Pair Trading Models
Pair Trading Lab offers pair trading algorithms based on various mathematical models. These are models currently supported in PTL:
Contents |
Ratio Model
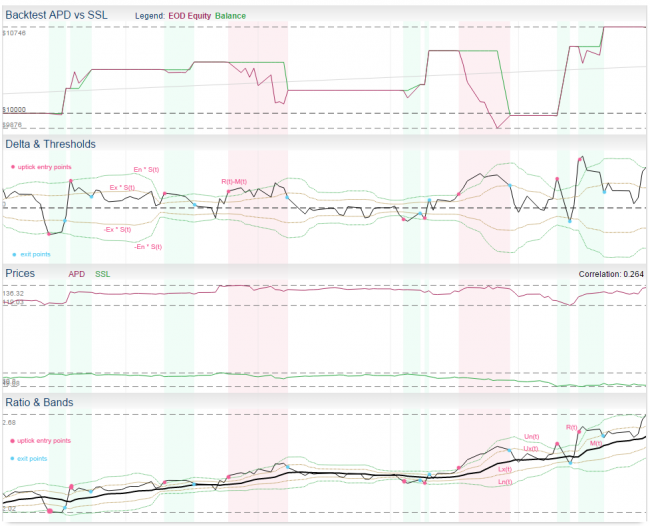
This is one of the standard pair trading models described in literature. It is based in ratio of instrument prices, moving average and standard deviation. In other words, it is based on Bollinger Bands indicator.
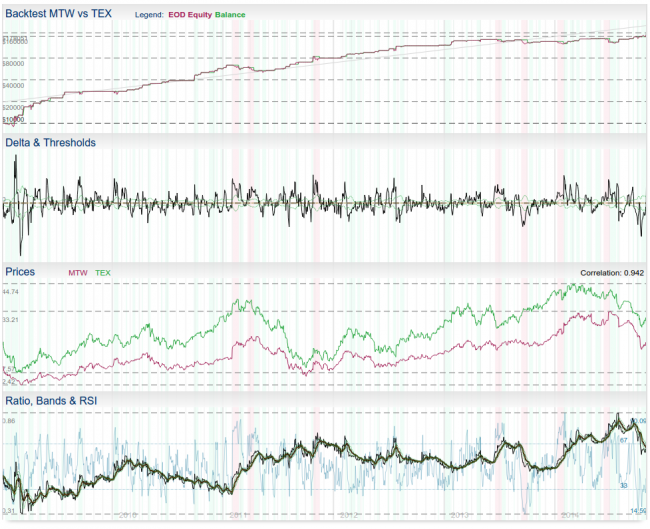
Since Nov 27th 2014, this model also supports additional RSI filter you can use in addition to Bollinger Bands method.
Model Support
- in PTL backtester: yes (max Z-score not supported)
- in PTL portfolio backtester: yes
- in PTL Trader: yes (RSI supported since v1.2.0)
Model Neutrality
We currently support only dollar-neutral version of this model, which means we allocate same amounts of margin to both legs based on current prices at the time of opening the position.
Model Parameters
- entry threshold En for Z-score, typical value range is <1.5, 2.5>, 2.0 is used most often
- exit threshold Ex for Z-score, typical value is <-0.5, 0.5>, 0 is used most often...negative values are allowed (to exit on other side)
- downtick threshold Ed for Z-score, typical values is <0, 1>, 0 is used most often...only used for downtick entry mode as a third band
- max Z-score Emax (optional, to filter out extremes, typical value is >4 if used)
- moving average period Pm (typical range <10, 100>), default = 15
- moving average type T (algorithm), default = exponential
- standard deviation period Ps (typical range <10, 100>), default = 15
- entry mode (simple, uptick, downtick)
- RSI period and threshold (optional RSI filtering)
Description
- we trade pair of stocks A, B, having price series A(t), B(t)
- we need to calculate ratio time series R(t) = A(t) / B(t)
- let's apply moving average of type T with period Pm on R(t) to get time series M(t)
- let's apply standard deviation with period Ps on R(t) to get time series S(t)
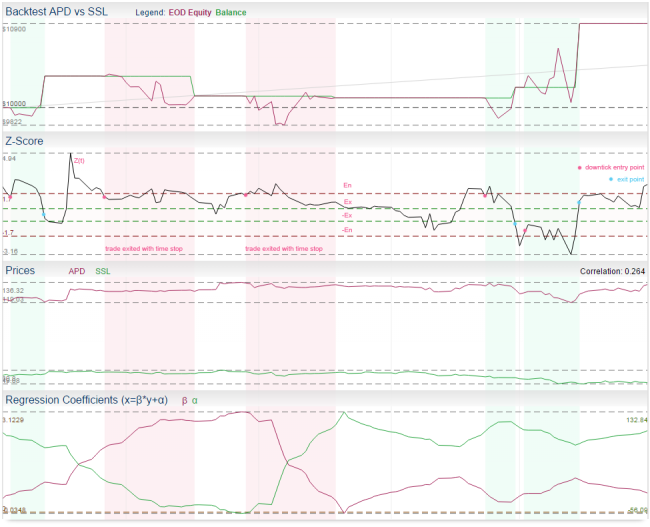
- now we can create Z-score series Z(t) as Z(t) = (R(t) - M(t)) / S(t), this time series can give us z-score to signal trading decision directly (in reality we have two Z-scores: Z-scoreask and Z-scorebid as they are calculated using different prices, but for the sake of simplicity let's now pretend we don't pay bid-ask spread and we have just one Z-score)
- another common approach (to visualize) is to create bands and put it above the moving average M(t):
- upper entry band Un(t) = M(t) + S(t) * En
- lower entry band Ln(t) = M(t) - S(t) * En
- upper exit band Ux(t) = M(t) + S(t) * Ex
- lower exit band Lx(t) = M(t) - S(t) * Ex
- upper downtick band Ud(t) = M(t) + S(t) * Ed (applies to downtick entry mode only)
- lower downtick band Ld(t) = M(t) - S(t) * Ed (applies to downtick entry mode only)
- these bands are actually the same bands as in Bollinger Bands indicator and we can use crossing of R(t) and bands as trade signals
Entering Position
There are certain possible approaches how to interpret model statistics in order to make trading decisions. For entering position, we used to call them entry modes. This is the list of them and description how they work:
- entry mode = simple:
- to open short pair position, it is simple enough if the Z-score Z(t) >= En (equivalent to R(t) >= Un(t))
- to open long pair position, it is simple enough if the Z-score Z(t) <= -En (equivalent to R(t) <= Ln(t))
- entry mode = uptick: same as simple, but in addition, previous Z-score must be below the entry band (so we cross the band from inside to outside):
- to open short pair position, we require Z(t) >= En (equivalent to R(t) >= Un(t)) and Z(t-1) < En (same as R(t-1) < Un(t-1))
- to open long pair position, we require Z(t) <= -En (equivalent to R(t) <= Ln(t)) and Z(t-1) > -En (same as R(t-1) > Ln(t-1))
- entry mode = downtick: we wait for the Z-score crossing back the band from outside to inside (but it must stay above the downtick band):
- to open short pair position, we require Z(t) < En and Z(t-1) >= En and Z(t) > Ed
- when using bands, it is the same as having R(t) < Un(t) and R(t-1) >= Un(t-1) and R(t) > Ud(t)
- to open long pair position, we require Z(t) > -En and Z(t-1) <= -En and Z(t) < -Ed
- when using bands, it is the same as having R(t) > Ln(t) and R(t-1) <= Ln(t-1) and R(t) < Ld(t)
Why do we have the simple entry mode? In normal situations and backtests, it gives same results as the uptick mode. But the difference comes up while trading multiple pairs in portfolio. The simple mode allows you to jump in the position immediately after a new slot is freed, regardless of the previous Z-scores.
Which entry mode is better? Hard to tell, sometimes the uptick, sometimes the downtick. You have to do your homework and decide, which idea suits your trading style better. In general, uptick/simple mode is more aggressive, as it does not wait for first signs of spread mean reversion.
Exiting Position
For exiting position, we always use only these simple rules:
- we exit short position when Z(t) <= Ex (equivalent to R(t) <= Ux(t))
- we exit long position when Z(t) >= -Ex (equivalent to R(t) >= Lx(t))
Moving Average Types
You can choose from these moving average algorithms:
- Simple Moving Average (SMA)
- Exponential Moving Average (EMA)
- Weighted Moving Average (WMA)
- Double Exponential Moving Average (DEMA)
- Triple Exponential Moving Average (TEMA)
- Triangular Moving Average (TMA)
- Kaufman Adaptive Moving Average (KAMA)
- MESA Adaptive Moving Average (MAMA)
- Triple Exponential T3 Moving Average
Which one is the best? It depends, you have to test for yourself. They mostly differ in the term of memory and how fast they react to changes. Industry standard and the default is EMA. We suggest to try all of them on some sample pair to see how they work.
RSI Filtering
You can combine the Z-score/Bollinger Band model with RSI indicator applied on the ratio R(t). RSI filter will be automatically enabled if you set RSI threshold to other value than zero. RSI filter is combined with the Z-score rules using AND operator (both entry rule and RSI entry rule must be true to open a position).
You can also change the RSI period if you want (default period = 15).
RSI Threshold is value between 0 and 50. Because RSI indicator value oscillates between 0 and 100 (where 50 = mean), your threshold value is just used to set real thresholds for RSI:
- let's assume RSI Period Pr was entered
- effective RSI value threshold is then 50+Pr (upper) and 50-Pr (lower)
- you can see both thresholds in the example image at the right side
Example:
- RSI Threshold entered is 15
- then, short positions are only opened, if RSI >= 65 (50+15)
- long positions are only opened, if RSI <=35 (50-15)
Useful hint: if you want to control entry rules just by RSI, you can set Entry Mode to simple and Entry Threshold to some low value.
Residual Model
Residual mode is based on linear regression. In literature it has been also referred to as the cointegration approach. Linear regression of both stocks is constructed in order to fit a linear relationship between both instruments and estimate its best parameters using the OLS method (Ordinary Least Squares). Then, standard deviation is applied on the regression residuals to estimate its statistical properties and calculate Z-scores.
This particular implementation is very simple. The regression is constructed using floating window of a fixed period, the same period is used for calculating the standard deviation.
Model Support
- in PTL backtester: yes (max Z-score not supported)
- in PTL portfolio backtester: yes
- in PTL Trader: yes (uptick and downtick modes are supported since v1.2.0)
Model Neutrality
We currently support only dollar-neutral version of this model, which means we allocate same amounts of margin to both legs based on current prices at the time of opening the position.
Model Parameters
- entry threshold En for Z-score, typical value range is <1.2, 2.5>, 1.5 is used most often
- exit threshold Ex for Z-score, typical value is <-0.5, 0.5>, 0 is used most often...negative values allowed (allows to exit at other side)
- downtick threshold Ed for Z-score, typical value is <0, 1>...used for downtick mode only as a third band
- max Z-score Emax (optional, to filter out extremes, typical value is >4 if used)
- linear regression period P (floating window is used), typical range <15, 300>
- entry mode (simple, uptick, downtick)
Description
- we trade pair of stocks A, B, having price series A(t), B(t)
- first we need to construct a linear regression between A(t), B(t) using OLS, where A(t) = β * B(t) + α + R(t)
- because we use floating window of period P (we calculate new regression each day), we actually get new series β(t), α(t), R(t), where β(t), α(t) are series of regression coefficients and R(t) are residuals (prediction errors)
- R(t) = A(t) - (β(t) * B(t) + α(t))
- then we apply standard deviation of period P on residuals R(t) and we put it to S(t)
- now we can create Z-score series Z(t) as Z(t) = R(t) / S(t), this time series can give us z-score to signal trading decision directly (in reality we have two Z-scores: Z-scoreask and Z-scorebid as they are calculated using different prices, but for the sake of simplicity let's now pretend we don't pay bid-ask spread and we have just one Z-score)
Entering Position
There are certain possible approaches how to interpret model statistics in order to make trading decisions. For entering position, we used to call them entry modes. This is the list of them and description how they work:
- entry mode = simple:
- to open short pair position, it is simple enough if the Z-score Z(t) >= En
- to open long pair position, it is simple enough if the Z-score Z(t) <= -En
- entry mode = uptick: same as simple, but in addition, previous Z-score must be below the entry band (so we cross the band from inside to outside):
- to open short pair position, we require Z(t) >= En and Z(t-1) < En
- to open long pair position, we require Z(t) <= -En and Z(t-1) > -En
- entry mode = downtick: we wait for the Z-score crossing back the band from outside to inside (while we must stay above the downtick band):
- to open short pair position, we require Z(t) < En and Z(t-1) >= En and Z(t) > Ed
- to open long pair position, we require Z(t) > -En and Z(t-1) <= -En and Z(t) < -Ed
Exiting Position
For exiting position, we always use only these simple rules:
- we exit short position when Z(t) <= Ex
- we exit long position when Z(t) >= -Ex
Kalman Model
This model is based on Kalman Filter. In this case, the filter is used here instead of linear regression to determine proper hedge ratio, deviation from the mean and the standard deviation of the spread. The advantage is that this filter is superior when dealing with noise compared to OLS or TLS methods, also it does not have any lookback period to optimize. The disadvantage is that is has another parameters (like δ) to find out.
We strongly recommend to read more details about Kalman filter applications in pair trading in this book.
While Kalman Filter also estimates the standard deviation on the fly, our implementation also supports a possibility of having an auxiliary standard deviation indicator applied directly on the forecast error time series. The advantage is that you get less sensitivity on the δ parameter, but on the other hand a new lookback parameter is introduced.
Kalman Model has too sensitive parameters which prevents it to be traded in reality. This model is provided only for education purposes - to be able to see how parameters affects its performance. Use Kalman Grid model for any serious trading.
Model Support
- in PTL backtester: yes (max Z-score not supported)
- in PTL portfolio backtester: not planned
- in PTL Trader: not planned
Model Neutrality
For Kalman Model, we support both dollar neutral (equal dollar amount invested to each leg) and beta neutral regimes.
Model Parameters
- Kalman filter transition covariance δ, typical value is 0.0001 - unfortunately this model is very sensitive to this parameter especially when using standard deviation estimate coming from the Kalman filter itself
- Kalman filter observation covariance Ve, typical value is 0.001
- auxiliary standard deviation period - if equal to zero, Kalman filter is used to estimate standard deviation, if non-zero, auxiliary standard deviation indicator with this period is used (an the estimate from Kalman filter is ignored)
- unstable period = how many Kalman filter observations are ignored at the beginning (first observations are quite unstable)
- entry threshold En for Z-score, typical value range is <1.2, 2.5>, 1.5 is used most often
- exit threshold Ex for Z-score, typical value is <-0.5, 0.5>, 0 is used most often...negative values allowed (allows to exit at other side)
- downtick threshold Ed for Z-score, typical value is <0, 1>...used for downtick mode only as a third band
- max Z-score Emax (optional, to filter out extremes, typical value is >10 if used)
- entry mode (simple, uptick, downtick)
Entering & Exiting Positions
Same as in Residual Model.
This model is provided for education purposes only.
Kalman-grid Model (v2)
This has been has been updated 2016-11-08. Please wait for the documentation update.
After one year of experience with the Kalman-grid Model (v1) and researching machine learning principles, we have spent weeks of additional work on developing new version of Kalman Grid model, redesigned from scratch. Kalman Grid v2 is now the most advanced model PTL offers and has no competition whatsoever. After proven as stable it will become the default model for the whole PTL ecosystem.
This model brings the superior performance of Kalman filter design, but it also deals with all the flaws of Kalman and old Kalman Grid v1:
- all parameters of Kalman filter have been eliminated (δ, Ve) - they are auto-estimated by the grid logic and updated with each price sample
- increased average performance compared to v1
- fixed issues of old version which prevented model to trade too often (biggest flaw of v1)
This model rendered the version 1 obsolete and completely replaces it.
How does it work? Instead of single strategy (and single Kalman filter), the whole grid of Kalman filters is evaluated by a proprietary system at the same time. Then, machine learning principles are applied to rank particular Kalman filter performances. Another algorithm is then used to figure filter outputs (slope, intercept, standard deviation) from the whole grid. The whole system actually behaves like a single Kalman filter, but with no need to provide any parameters.
As a side effect, the entry threshold is also auto-optimized by the grid system itself. This means that the entry threshold is always indicated as 1.0.
Main advantages of this model:
- it is robust (because there are no parameters to tune)
- beats any other models in performance (in average)
- no risk of over-fitting in parameter optimization (nothing to optimize)
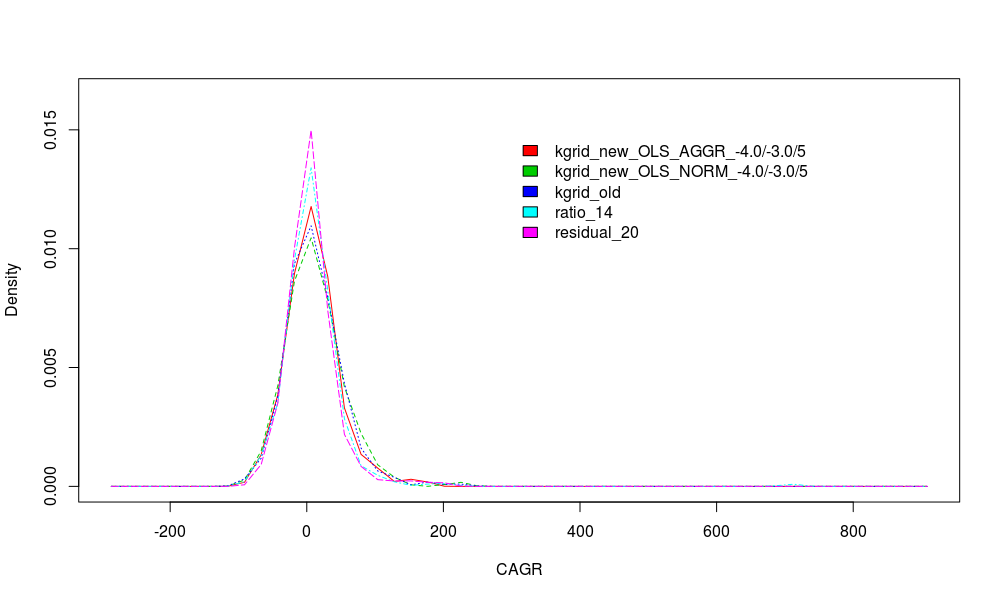
To give some insight on performance: we took 300 best performing pairs from PTL database in period Jan 2013 - Jan 2016. Then we backtested all 300 pairs using out-of-sample period (Jan 2016 - Sep 2016) and we compared their performance. Models used: Ratio(per 14), Residual(20), Kalman Grid v1, Kalman Grid v2 using exit threshold of -1 (normal) and 0 (aggressive). Margin 50% (Req-T). Results here:
| Model | Median CAGR % | Mean CAGR % |
| Kalman-grid v2 (normal) | 7.206409 | 9.538509 |
| Kalman-grid v2 (aggressive) | 7.088950 | 11.433199 |
| Kalman-grid v1 | 4.877391 | 10.794117 |
| Residual(20) | 3.596212 | 6.631089 |
| Ratio(14) | 3.590883 | 8.954484 |
You can clearly see how this model beats other models in out-of-sample performance (mixture of good and bad pairs).
Profit distribution over all models (300 pairs, out-of-sample):
Model Support
This model is currently in beta stage and requires more testing before it will be enabled in PTL Trader.
- in PTL backtester: yes
- in PTL portfolio backtester: yes
- in PTL Trader: planned Dec 2016
Model Neutrality
For Kalman Grid Model, we support both dollar neutral (equal dollar amount invested to each leg) and beta neutral regimes.
Kalman-Auto Model
This section is under construction
This model is similar to Kalman-grid model, but it is more simple. This model does not optimize profit, but instead it optimizes margin usage to match predefined target. This model is very robust (is not fooled by glitches in performance) and it automatically optimizes entry rules (thresholds).
Model Support
This model is currently in beta stage and requires more testing before it will be enabled in PTL Trader.
- in PTL backtester: yes
- in PTL portfolio backtester: planned Dec 2016
- in PTL Trader: planned Dec 2016
Model Neutrality
For Kalman-Auto Model, we support both dollar neutral (equal dollar amount invested to each leg) and beta neutral regimes.
Model Parameters
- Kalman filter observation covariance Ve, typical value is 0.001
- Usage Threshold in %, allowed range <20, 80>
Deprecated Models
- Orthogonal Model
- Kalman-grid Model (v1)


